Blog /
Industry Insights
UK TNUoS Charges are rising - what does that actually mean?
March 24, 2026
UK TNUoS Charges Are Rising 60%. Here's What Some Solar Companies Are Getting Wrong About It.
You've probably seen it on LinkedIn already.
There are lots of solar company posts about the upcoming 60% increase in Transmission Network Use of System charges (TNUoS), using it as a compelling reason for businesses to invest in solar and batteries. The logic seems intuitive: grid costs are rising, so go behind the meter.
It's a reasonable instinct. But it's not quite the whole picture. For most businesses, this specific increase is largely beyond the reach of solar and batteries — with one very notable exception that we’ll explore in this blog. And if you're using the 60% headline to sell projects without understanding where the increase actually sits, you risk making claims that don't hold up to scrutiny.
Let's look at what's actually happening, and where the genuine opportunity lies.
Why TNUoS charges are increasing
TNUoS charges exist to recover the cost of building and maintaining the national transmission network -the high-voltage infrastructure that moves electricity from generators to demand centres across the UK.
And right now, that network is under significant strain. The energy transition is placing enormous new demands on a grid that was designed for a different era. Renewable generation is being connected in locations far from demand centres. Electric vehicles, heat pumps, and new industrial loads are reshaping consumption patterns. New interconnectors, substations, and reinforcements are needed at scale.
The bill for all of this is being passed on to electricity users. The ~60% increase in 2026/27 reflects that investment pipeline. The total residual revenue pool is rising from £3.84 billion to £6.27 billion - and that money has to come from somewhere.
The question isn't whether transmission costs are going up. They are, and there are legitimate structural reasons why. The question is how those costs are being recovered.
The problem: almost all of it is fixed
When we analysed the NESO tariff tables for 2025/26 versus 2026/27, the composition of the increase was stark.
Nearly the entire increase is concentrated in the fixed residual component - a standing charge levied per site per day, regardless of when or how much electricity is consumed. Depending on connection band, that fixed charge is rising by between +28% and +116%.
Meanwhile, the HH demand charges (the tariff component linked to peak consumption during Triad periods, the one that rewards businesses for reducing demand when the grid is most stressed) have actually fallen in most zones for 2026/27. The NHH volumetric charge has seen negligible movement.
The result is a tariff structure where your behaviour as an electricity consumer increasingly doesn't affect your transmission costs.
This is the missed opportunity in how these charges have been constructed. Transmission charges should send a price signal back to end customers: use less electricity when the grid is under pressure, and your costs fall. That signal creates a direct financial incentive for flexibility — for investing in batteries, for shifting loads, for reducing demand during peak periods. It makes the system more manageable and rewards businesses for doing so.
Flatten those charges into a fixed fee and that incentive disappears. Businesses have no financial motivation to flex their consumption. The grid loses a demand-side lever precisely when it needs it most. And the very investment in grid modernisation that's driving the cost increase becomes harder to justify, because the tariff structure is no longer directing consumer behaviour in ways that help manage the constrained system.
It's a counterproductive design, and it deserves a lot more scrutiny than it's currently getting.
Of the markets we currently operate in - Australia, New Zealand, Germany, Ireland and the UK - the UK's network tariffs are the most poorly designed when it comes to flexibility incentives.
Back to those LinkedIn posts
So — what about the posts claiming TNUoS increases are a reason to invest in solar and batteries?
Here's the nuance that matters. Solar and battery systems are genuinely excellent investments for UK C&I businesses right now. The economics are compelling, the technology has matured, and between improving solar self-consumption and arbitrage opportunities that exist in DUoS charges, capacity market levies and electricity market participation, there are real, bankable value stacks available.
But a 60% increase in a fixed standing charge cannot be addressed by installing solar or a battery - except in specific circumstances where a site can demonstrate a sustained reduction in its Maximum Import Capacity (MIC) large enough to move to a lower residual charging band (more on that below).
In all other cases, these fixed charges can't be reduced. They are the same whether you have 500 kWh of battery storage on site or nothing at all.
Using this specific increase as a headline reason to buy solar and batteries conflates two separate things: the existence of a large grid cost with the ability of behind-the-meter technology to reduce the TNUoS costs. The former is real. The latter, in most cases, isn't — and the exception requires careful modelling to establish whether it applies.
This matters because our industry's credibility depends on giving customers accurate information. Claims that don't hold up under scrutiny erode trust — not just for the company making them, but for the sector more broadly.
The exception worth knowing about: moving to a lower residual charging band
There is a mechanism through which solar and battery investment can reduce exposure to the fixed residual charge — but it's narrow, and it takes careful planning and execution.
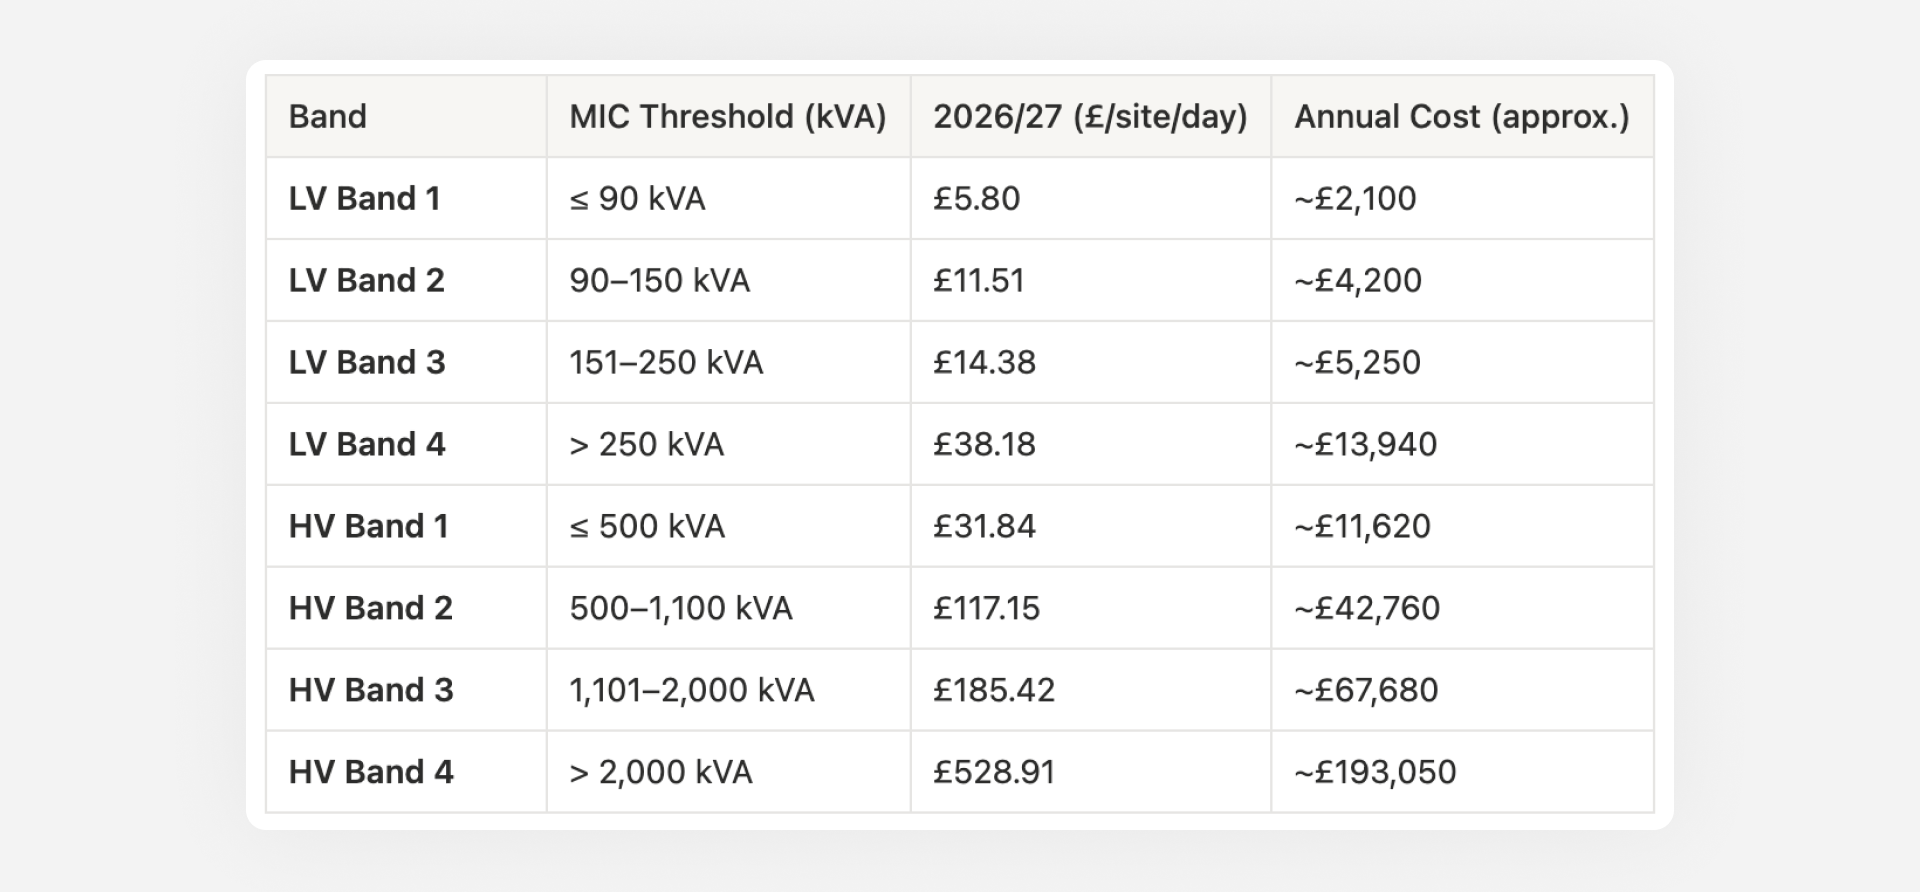
When it comes to the fixed components of TNUoS and DUoS charges, UK businesses are allocated to one of four residual charging bands (Bands 1–4) based on their Maximum Import Capacity (MIC), with band boundaries set at the 40th, 70th and 85th percentiles of MICs nationally. These bands are locked in for the duration of a price control period that runs to 2031.
TNUoS Residual Charging Bands — 2026/27 Final Tariffs (£/site/day)
Distribution charges (DUoS) vary by DNO region but broadly follow the same four-band structure for their fixed components.
To move to a lower band mid-period, under Schedule 32 of the DCUSA, you need to demonstrate a reduction in MIC of more than 50% to trigger a move to a lower residual band before 2031. You also need to prove MIC reduction with actual load data. That's a very high bar. A typical commercial solar and battery system might achieve a 25–30% demand reduction. Getting to 50% requires a very large solar array, a substantial battery, and a load profile that cooperates, and, most importantly, a customer willing to give up their contracted capacity. Rightly or wrongly, the network companies have done an excellent job of putting the fear of God into customers: once you give up your contracted capacity, its hard to get it back.
If you can’t achieve the MIC reduction of 50%, there’s still hope. At the end of each price control period, DNOs use the average MIC over the prior 24 months to determine which band a site falls into for the next period. A site will automatically be moved down (or up) a band if it qualifies. To drop to a lower band level by this route, a business ideally needs to have their solar and battery solution installed and operating at least three years before April 2031 — roughly a year to gather data, then two years at the new MIC level so the 24-month average reflects the full saving.
While dropping bands is hard, for high voltage (HV) customers in particular the cost difference between bands can be substantial — dropping from HV Band 4 and HV Band 3 saves £125k p.a. just on the TNUoS charges. There maybe similar savings on the DUOS residual band charges (albeit DNO region specific). This pathway is genuinely worth modelling to explore it. It's not the primary value story for C&I solar and batteries — but it's a real one, and for the right site it can fundamentally change the opportunity.
This is precisely why upfront feasibility modelling is so important. Whether band migration is achievable — and worth pursuing — depends on variables that interact in ways that aren't obvious from first principles: the site's current MIC, its load profile, the system size required to sustain the reduction, and the customer's appetite for reducing contracted capacity. You need to run the numbers properly before making it part of an investment case. Presenting it as a likely outcome without that analysis is how credibility gets lost.
The honest framing for customers: solar and batteries won't reduce fixed TNUoS exposure in most cases, but if your MIC is large enough, the systems are sized aggressively enough and you have a customer willing to reduce their MIC, band migration is a legitimate target that can become part of the investment case.
Where the genuine value sits
For the vast majority of UK C&I solar and battery projects, the value stack looks like this:
Solar continues to make a compelling standalone case — generating cheap on-site electricity during peak daytime consumption, reducing import volumes, and paying back on increasingly strong commercial terms.
Batteries add real value through DUoS Red period avoidance, wholesale time-of-use arbitrage, P415 baselining, and for larger sites, the potential for MIC reduction over time.
These are the value streams that deserve to be front and centre in the conversation with customers. They're real, modellable, and defensible.
The TNUoS increase is a legitimate reason to have a broader conversation with customers about their network cost exposure. But let the numbers do the honest work — rather than reaching for a headline that doesn't quite stack up.
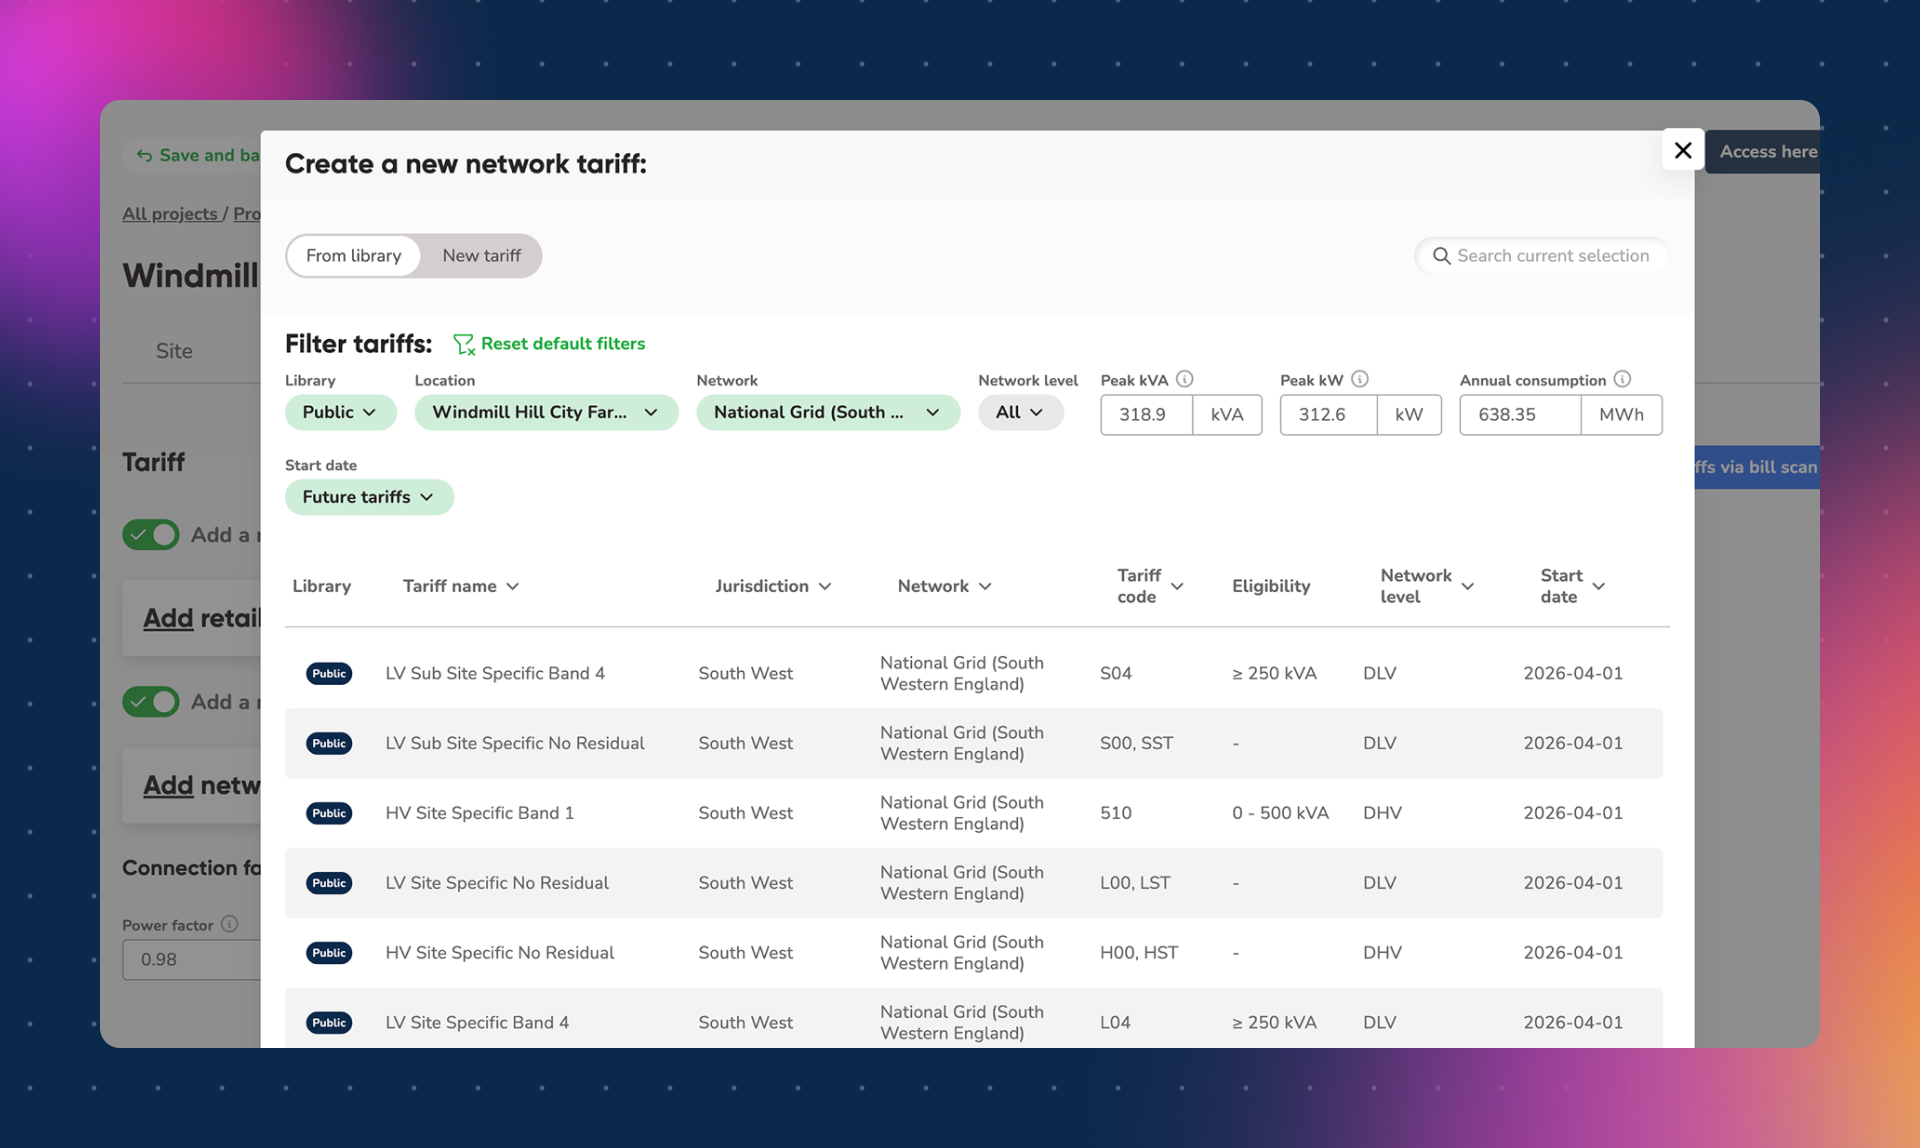
As of this week, the 2026/27 network tariffs — including the updated TNUoS residual bands and DUoS charges across all 14 UK distribution regions — are now live in the Orkestra tariff library. That means you can model the full impact of these changes on any UK C&I project directly in the platform, with utility-grade accuracy, without having to track down and interpret the source documents yourself.
Want to see what the new tariffs mean for your projects? Start your free Orkestra trial.
Get your 3 week free trial
Get started exploring energy project feasibility analysis and reporting. Sign up now - no credit card required.