Blog /
Industry Insights
A Guide to Wholesale and FCAS Prices in the NEM (& Orkestra)
January 29, 2026
.png)
Modelling Battery Feasibility using Historic Datasets
Written by Andie Dertouzos, Customer Success Manager - APAC
With a new year upon us, it’s a great time to take a look back at the previous year and understand how the NEM behaved and changed. How we model is directly affected by the pricing we utilise to understand what may happen in the future.
One of the major benefits of Orkestra, as many of our customers would know by now, is that modelling batteries is a dangerous game when things look ‘too good to be true’. Typically, if this is the case, it probably is too good to be true. However, by having the ability to model many different sized and controlled batteries across a range of scenarios i.e. different price datasets and escalators, you can reveal how forecasts directly impact your customer’s project returns.
When modelling batteries, your choice of historic (or forecasted) wholesale and FCAS prices matter, it can invariably swing your project from an absolute ‘no way’ to a resounding ‘yes!’ The purpose of this blog is to take a step back, understand what is happening in the NEM, and how this will impact your projects in Orkestra.
Oh, and of course, guide you on how best to do this in Orkestra!
Note: This article references data available at the time of writing. Since publication, AEMO has released the Quarterly Energy Dynamics Q4 2025 report (January 2026). While the broader themes discussed below remain relevant, readers should consider the latest report alongside this analysis.
What We're Seeing in the NEM
Wholesale Energy Prices: A Downward Trend
The first half: Seasonal swings
Average energy prices were up 9% from the previous year, but there was a large variance across regions. Queensland saw prices drop 24% due to milder weather, while Tasmania surged 67% as hydro generators raised their offers to conserve low dam levels. Whilst a cold snap in June sent heating demand soaring just as wind generation dropped off, leading to the highest recorded daily average price in NEM history at $1,610/MWh.
The second half: The calm after the storm
Energy prices began their descent, dropping by 27% on average than the same time in 2024. Mild weather combined with record solar and wind output lowered prices, removing the ‘volatility premium’ seen earlier in the year.
Renewables driving prices down
The underlying trend is clear, renewable energy is pushing average prices down. We saw renewables provide nearly 43% of total electricity supply in Q3 2025. This abundance of cheap power, particularly from solar, consistently drove wholesale prices down during daylight hours.
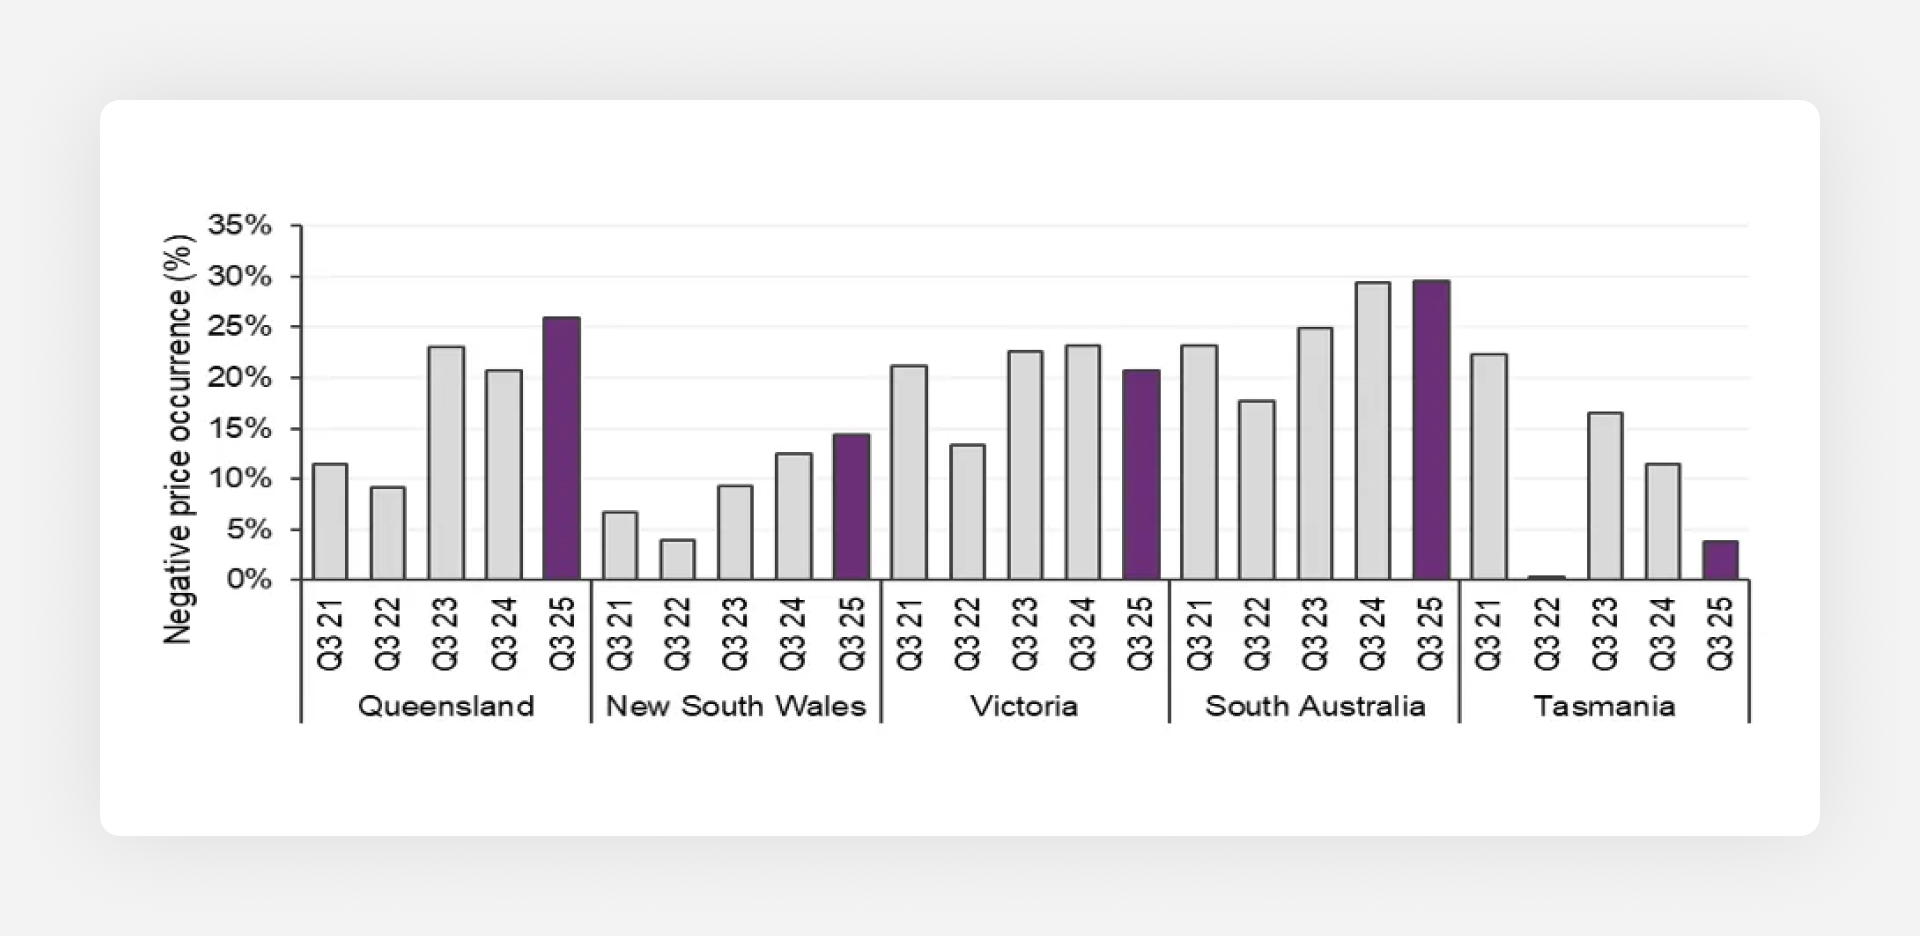
Negative Pricing: The (shallower) new normal
The frequency of negative energy prices has continued to grow. Negative prices are becoming more prevalent across all states except Tasmania (where Basslink transfer fee changes have shifted the marginal cost of energy). However, they are slowly edging their way closer to $0 with the average in Q3 of 2025 being -$16/MWh vs. -$33/MWh the year prior. A major cause of this is the falling value of LGCs as renewable supply skyrockets.
Negative Price Outcomes by State
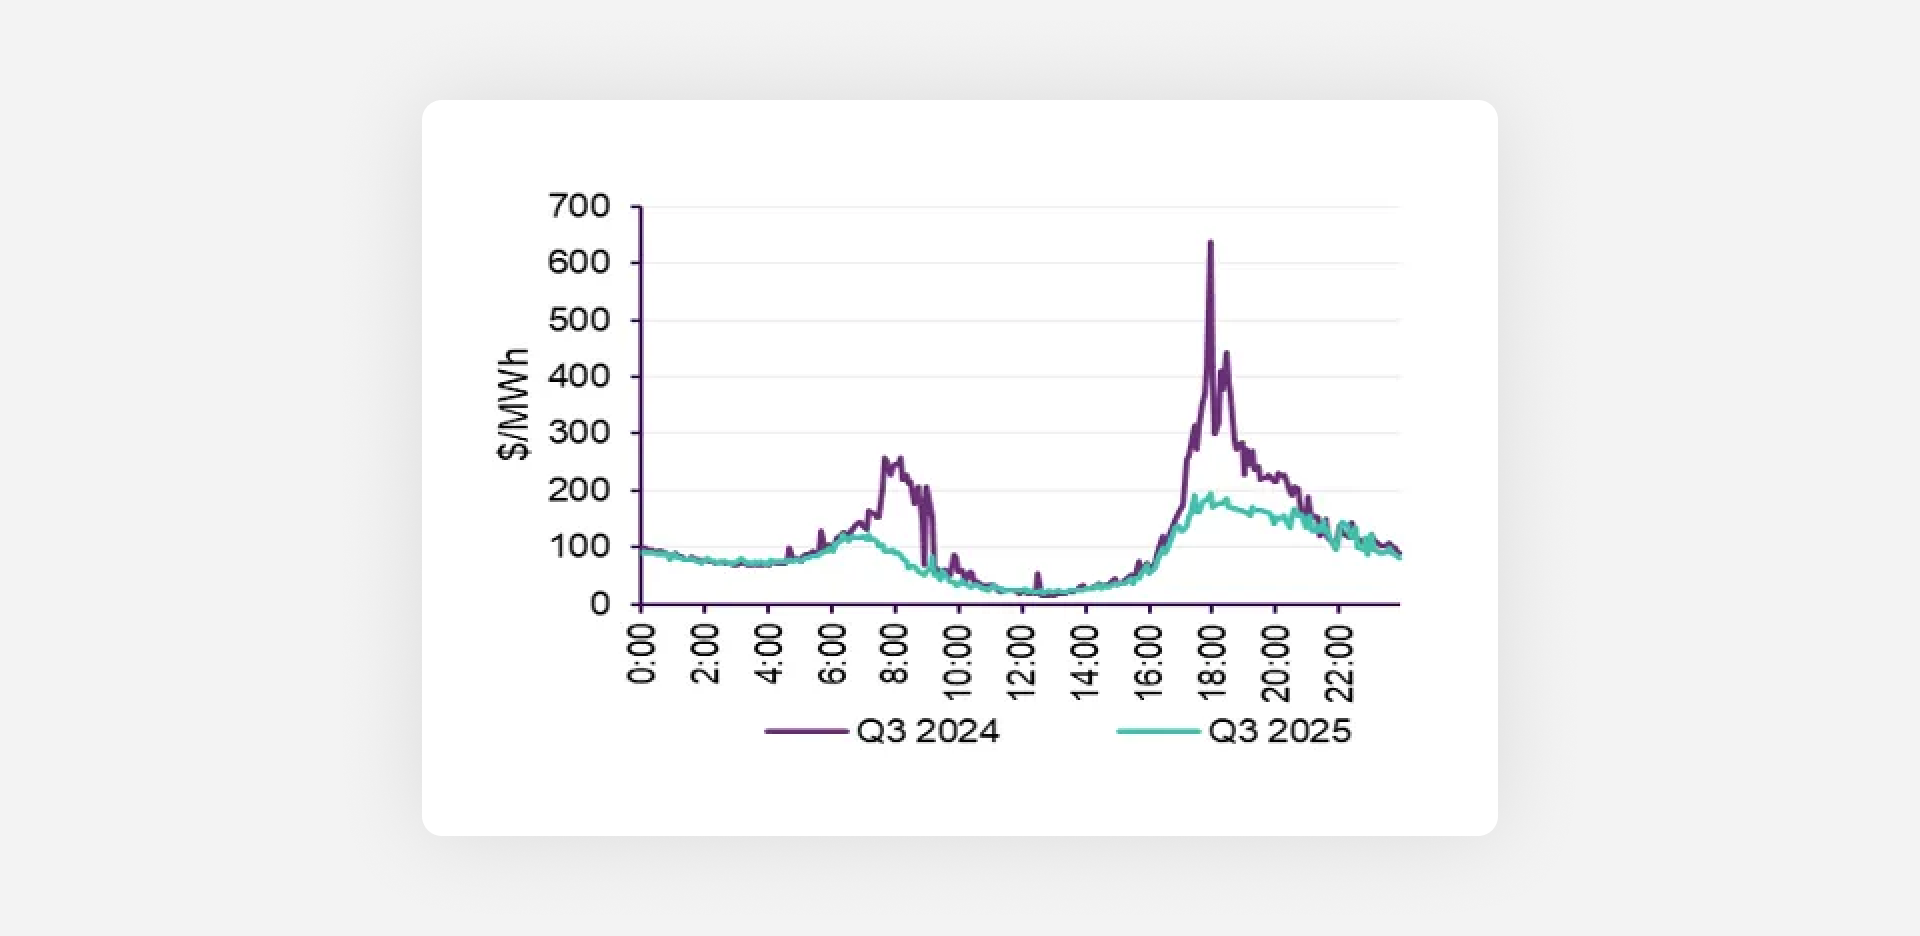
Several factors drove this decline
- Higher operational demand was met with increased coal generation, reducing volatility
- Wind generation picked up during evening peaks (up 2.5%)
- The growing battery fleet smoothed out evening peak pricing, reducing reliance on gas and hydro - see below:
Change in Average Prices from 2024 to 2025
Key Learnings
- The general trend in wholesale energy prices in 2025 was notably shifted down with more stability across the grid
- Renewables are driving the cost of energy down
- Negative prices during the day have been sustained since 2024 (or grown in some cases), but the magnitude of these prices has decreased
FCAS in 2025
The first half: Record lows
FCAS costs plummeted, to nearly half the previous year's levels. With fewer grid emergencies, the abundance of battery capacity provided cheap backup services.
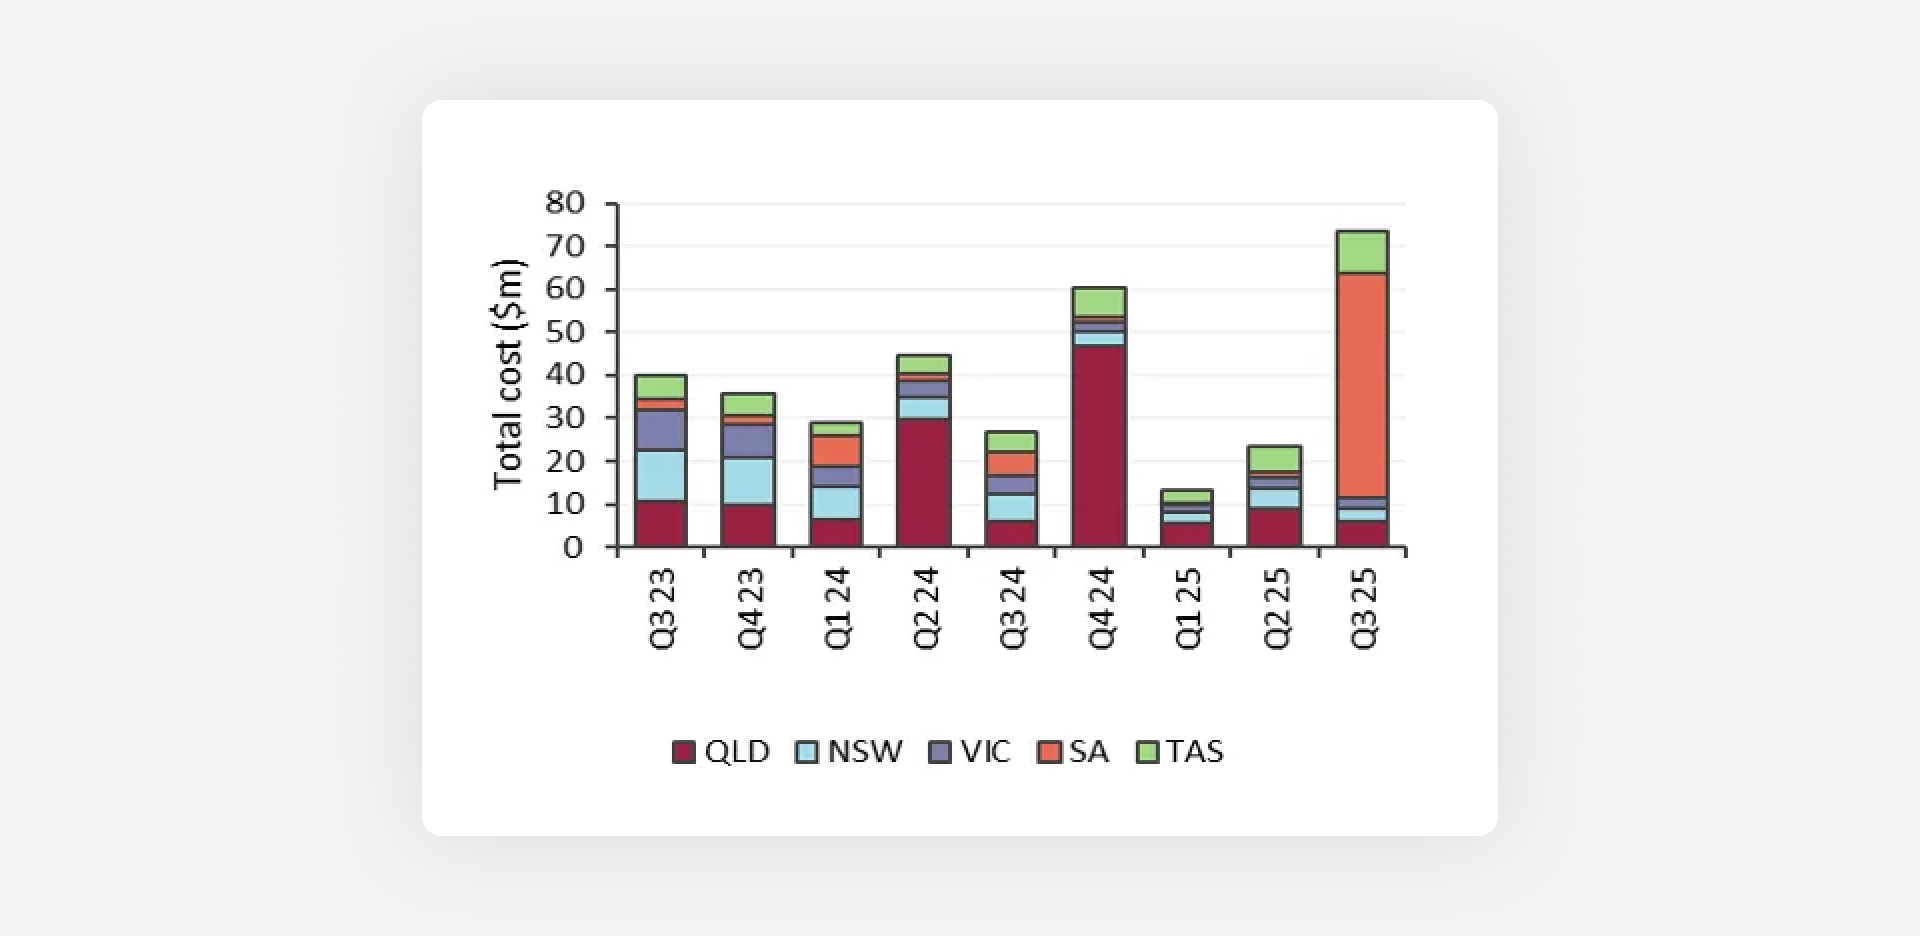
The second half: The South Australian spike
Q3 saw a major shift as costs rose to $73 million, almost triple Q3 of the previous year. This was a result of planned maintenance restricting the Heywood interconnector, forcing AEMO to procure expensive local services within South Australia to manage islanding risk. This single event drove a $47 million cost increase, making up a large share of the total battery revenue.
Total FCAS Costs per Quarter
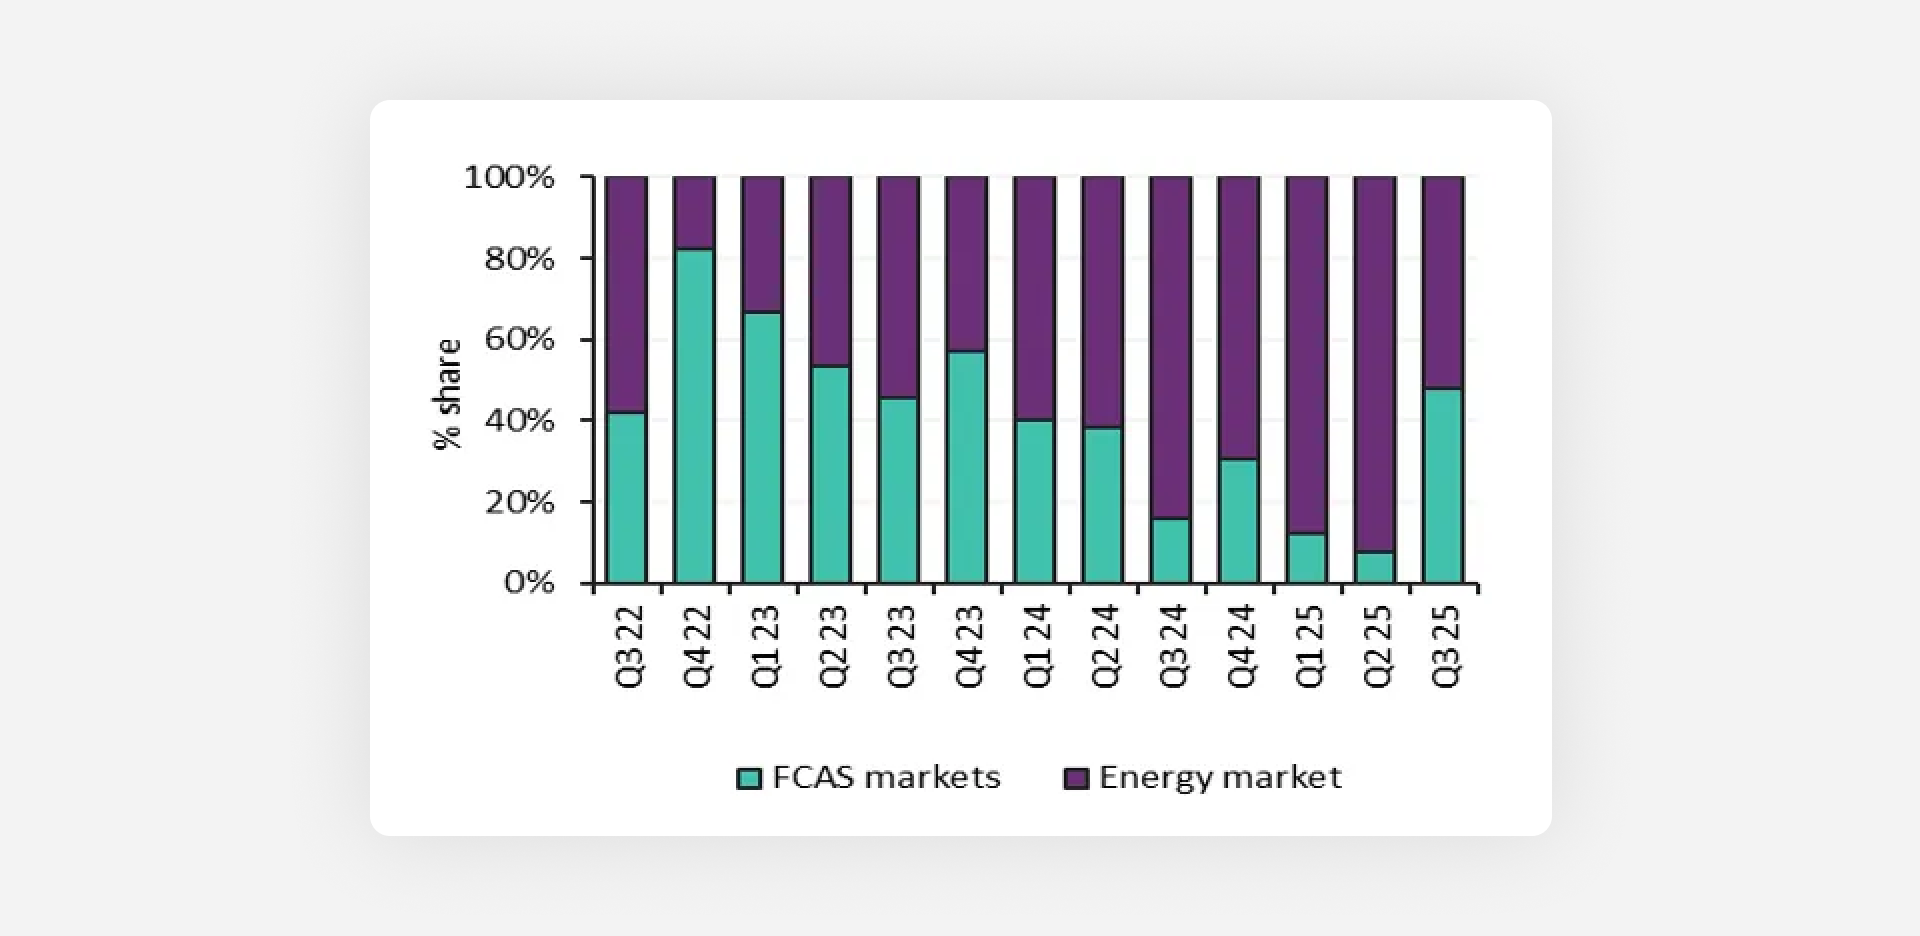
The battery takeover continues
Batteries now dominate FCAS provision, consistently capturing 55 - 60% of market share throughout 2024-2025. They've effectively displaced older coal and hydro generators from the frequency control market.
Regional constraints are the new normal
High FCAS costs are increasingly driven by localised network constraints rather than system wide issues:
- Late 2024: Queensland was the expensive region (QNI interconnector outages)
- Late 2025: South Australia took the spotlight (Heywood interconnector restrictions)
- Tasmania: Also saw elevated costs due to Basslink limitations
The Trend of Battery Revenue Share between the FCAS and Energy Market
Key Learnings
- The greater consistency of wind and increased share of batteries in the market meant the grid was more stable compared to 2024
- FCAS has sustained a relative downward trend over the last few years in ‘share of revenue’ from battery activity
Applying your Insights: Multiple Scenario Analysis & Forecast Consideration in Orkestra
So what does this mean for your battery modelling?
More stable wholesale energy prices means potentially ‘less exciting’ outcomes for your battery. As always, this is why we favour multiple sources of revenue when modelling batteries in Orkestra to unlock the full Value Stack. Consider peak demand shaving and potential ‘avoided’ costs (i.e. the cost of backup) alongside your FCAS and wholesale arbitrage.
Average Energy Prices
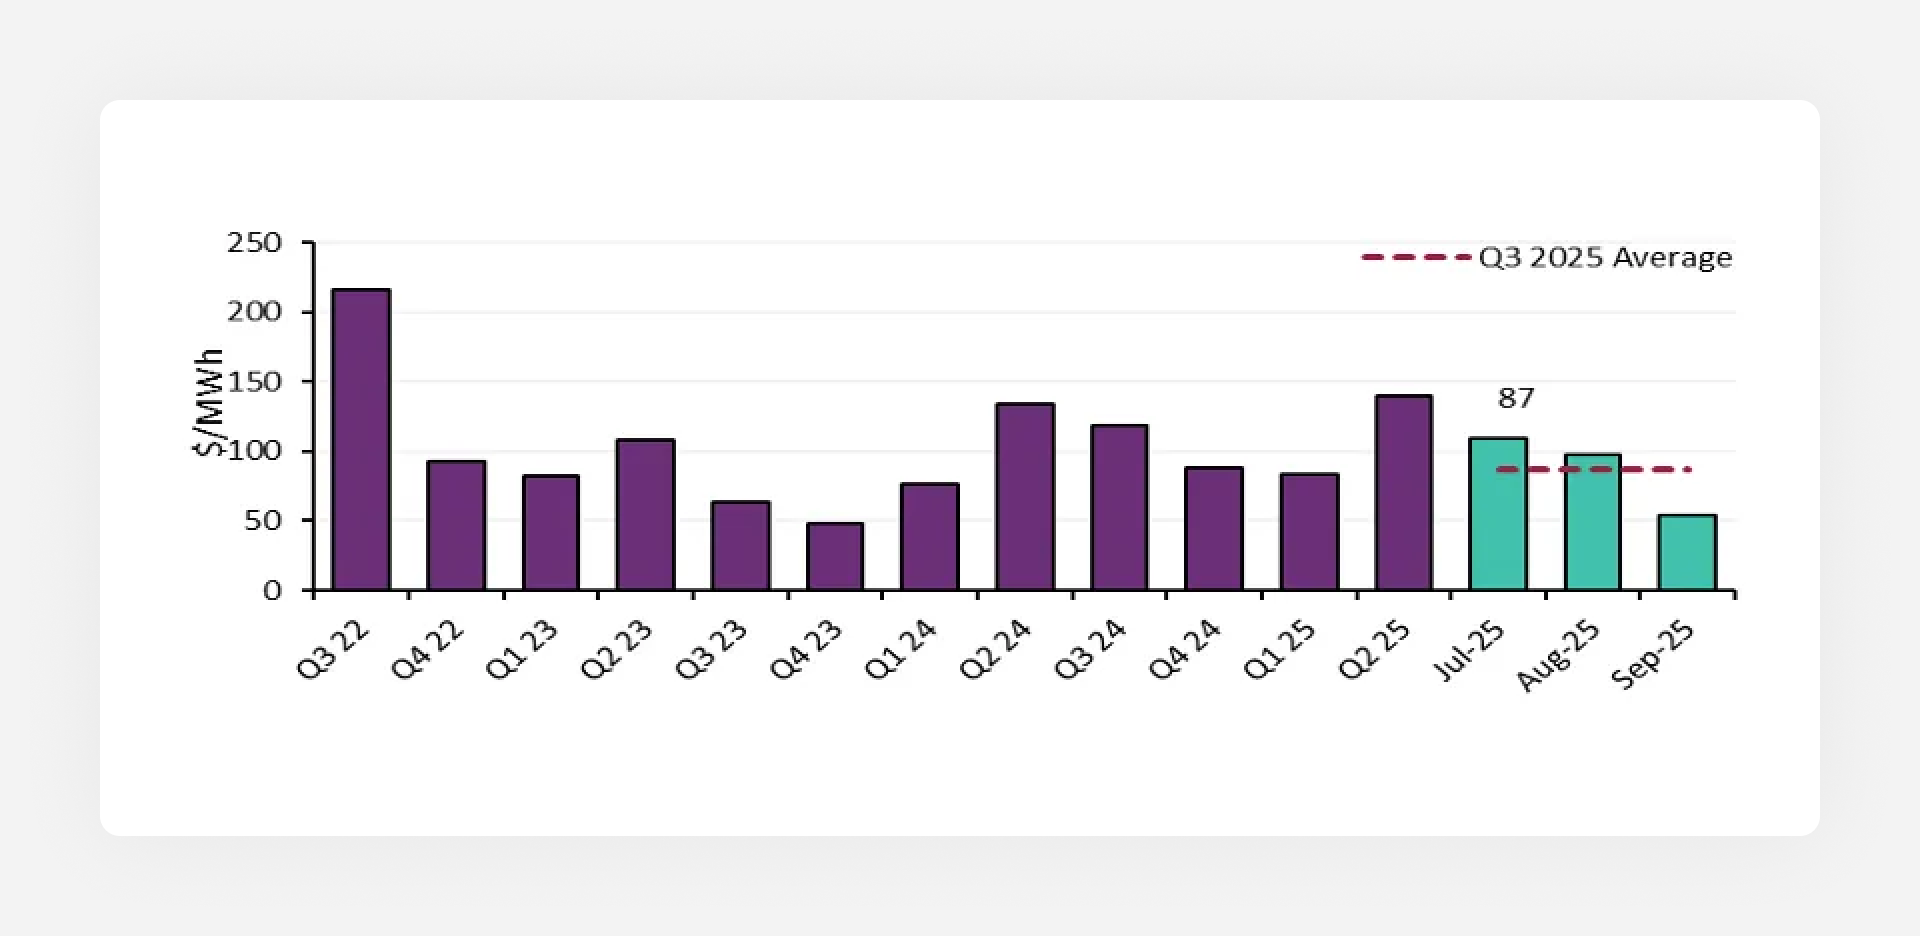
Price dataset choices
When modelling batteries in Orkestra, we recommend using multiple scenario analysis and considered escalators. By comparing different year datasets (e.g., 2024 vs. 2025), you can present customers with a realistic range of outcomes, from conservative to optimistic. Start with the most recent year and work backwards, we all know the most recent 12 months is always the best indication of the future.
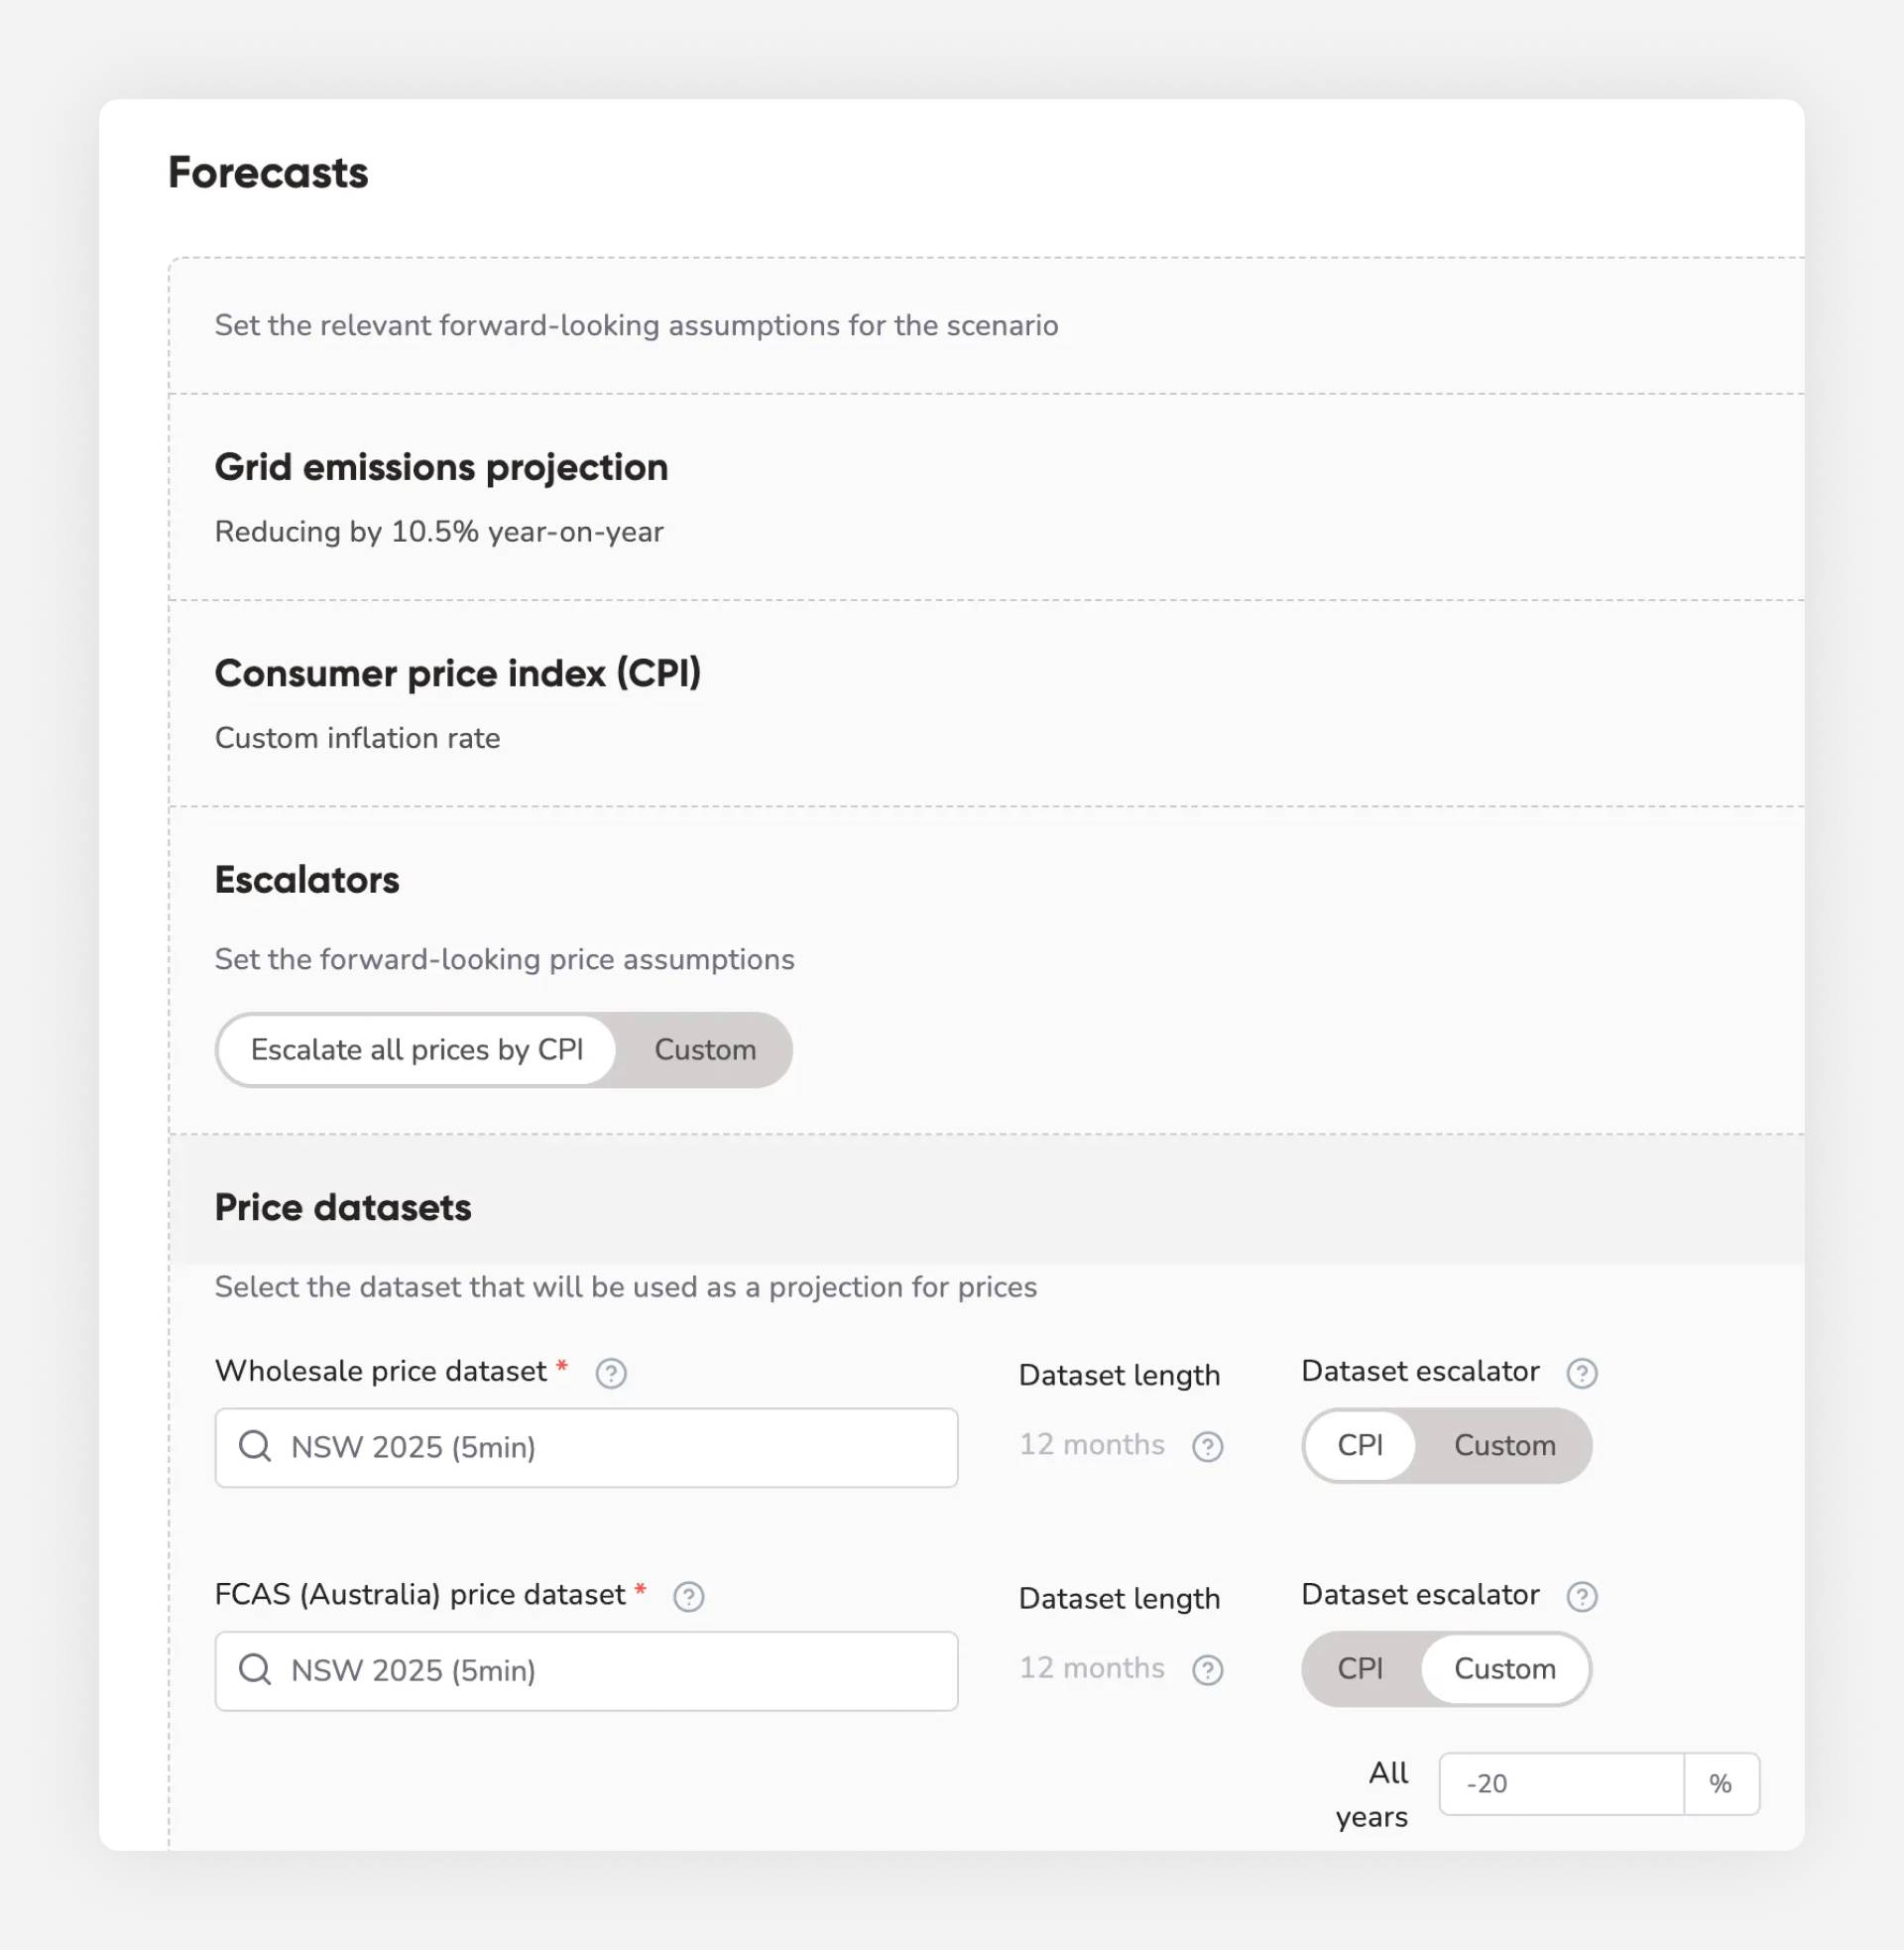
Escalators
Carefully consider your chosen dataset and corresponding escalations - our recommended ‘default escalation’ currently follows the decline we’ve seen over recent years to FCAS growth. However, it is always best to speak to the party conducting any FCAS activity for your customers to decide what is appropriate here. Similarly on the wholesale dataset front, get your customers involved here to make sure your escalation estimates fit in with their business model, a simple CPI escalation is a relatively safe place to start.
Step-by-Step Guide:
- Set up comparative scenarios using different historical price years
- Adjust forecasts appropriately to safely estimate reasonable outcomes
- Filter your results to focus on the battery sizes most relevant to your project
- Sort by payback period, NPV or any relevant metric appropriate to your project to quickly identify which scenarios are most attractive
.png)
In this example, you can see that 2024 pricing delivers a slightly better payback than 2023. While the difference may seem small here, comparing 2023 to 2025 datasets shows a much larger disparity, underscoring why your price dataset choice matters.
Key Learnings
- With lower wholesale energy prices, wholesale arbitrage will not make up all of your battery revenue to get a project over the line. Utilise multiple control profiles and scenarios i.e. peak shaving, FCAS, wholesale arbitrage and other avoided costs to the business
- Understanding the worst and best case scenario before bringing a solution to a customer is key - capitalise on Plan’s ability to model many different price datasets to compare
- Exercise caution with your use of escalations, particularly with FCAS - a negative escalation seems appropriate looking back on the last few years
- Visit the Knowledge Hub - this holds the keys to unlocking value in Orkestra
In Summary
- Wholesale prices are declining due to increased renewable penetration and battery deployment
- FCAS markets are generally delivering less but deliver strong returns during grid events
- Wholesale prices have stabilised, creating an increased need for more forms of revenue
- Always model multiple scenarios to give customers realistic expectations
- Consider forecasts and ****rely on third parties in the FCAS space to stay well informed
- Diversify - consider the whole Value Stack when modelling batteries
By staying informed about NEM trends and using Orkestra's scenario tools effectively, you'll be better positioned to deliver accurate, defensible battery business cases.
If you'd like specific guidance on setting up scenarios in Orkestra, please don't hesitate to reach out to our team - we're here to help.
New to Orkestra? Start a free 3 week trial today and we'll be in touch to help guide you through your first project.
Get your 3 week free trial
Get started exploring energy project feasibility analysis and reporting. Sign up now - no credit card required.
Sign up today