Blog /
Industry Insights
Unlocking New Revenue Streams with FCAS
April 30, 2025
If you're a solar consultant, energy services provider, or installer working on commercial projects in Australia, you've likely focused on helping clients reduce energy costs through solar and battery investments. But are you tapping into all the available opportunities to drive value from solar?
One such value maximiser, is Frequency Control Ancillary Services (FCAS). You probably come across it regularly, but what exactly IS frequency control? How does the FCAS market in Australia work, and - critically - should your clients consider participating? If they did, how can you calculate and communicate this potential value to them when modelling project feasibility?
In this article we give you the clarity to advise on that decision, including the technical, regulatory, and financial implications. Let's dive in!
Understanding Frequency Control and Its Market
The Australian power grid requires frequency control to maintain stability. The Australian Energy Market Operator (AEMO) compensates participants for providing these services. In 2023 alone, AEMO paid $135 million to frequency control providers.
However, while the potential earnings are attractive, participating in this market is complex. Businesses must navigate regulatory compliance, manage irregular income, work with partners, and avoid penalties for non-compliance. Therefore, frequency control should be seen as an additional benefit of your investment, rather than the primary reason for it.
Why Frequency Control Matters
Grid frequency stability is crucial. A notable example is the 2016 statewide blackout in South Australia, which affected 1.7 million people due to a frequency drop caused by a major storm.
To manage these challenges, AEMO established Frequency Control Ancillary Services (FCAS) markets, which ensure the grid operates at a stable 50 Hertz. These markets facilitate rapid adjustments in power supply and demand, preventing fluctuations that could lead to widespread power failures.
How the Frequency Control Markets Work
A good place to start here is with the three golden rules of FCAS:
- You get paid for capacity (energy available) in $/MW per hour.
- You don’t get paid for throughput (although energy will be paid for by the wholesale market).
- You can participate in all markets at once as long as you have 10 mins of energy available.
Participants bid their capacity ($/MW per hour) in 5-minute intervals, and AEMO's automated system determines pricing and allocations.
The ten FCAS markets are categorised into:
- Regulation Markets: Small, continuous adjustments made every 4 seconds to maintain stability.
- Contingency Markets: Larger, rapid responses to unexpected grid disruptions, with response times ranging from 1 second to 5 minutes.
Regulation markets are provided by utility scale energy generators via an automated system called the Automatic Generation Control.
Contingency markets are where your solar and battery project could get involved. Market participants bid the capacity they wish to offer for each given 5 minute interval and the lowest price they will accept. An automated clearing process allocates winners, prices and earnings based on the requirement. The eight markets for managing contingency events are:
- Very fast raise - 1 second response to arrest a major drop in frequency.
- Very fast lower – 1 second response to arrest a major rise in frequency.
- Fast raise – 6 second response to arrest a major drop in frequency.
- Fast lower – 6 second response to arrest a major rise in frequency.
- Slow raise – 60 second response to stabilise frequency after a major drop.
- Slow lower – 60 second response to stabilise frequency after a major rise.
- Delayed raise – 5 minute response to recover frequency to the normal operating band.
- Delayed lower – 5 minute response to recover frequency to the normal operating band.
Tip: Did you know Orkestra now enables you to model your potential revenue from participating in the 1-second FCAS market? Find out more and get started!
Get your 3 week free trial
Get started exploring energy project feasibility analysis and reporting. Sign up now - no credit card required.
Sign up todayFCAS Example: Hornsdale Power Reserve
The largest provider of Contingency FCAS in Australia is the Hornsdale Power Reserve in South Australia. The chart below shows 3 months of revenue in 2024.
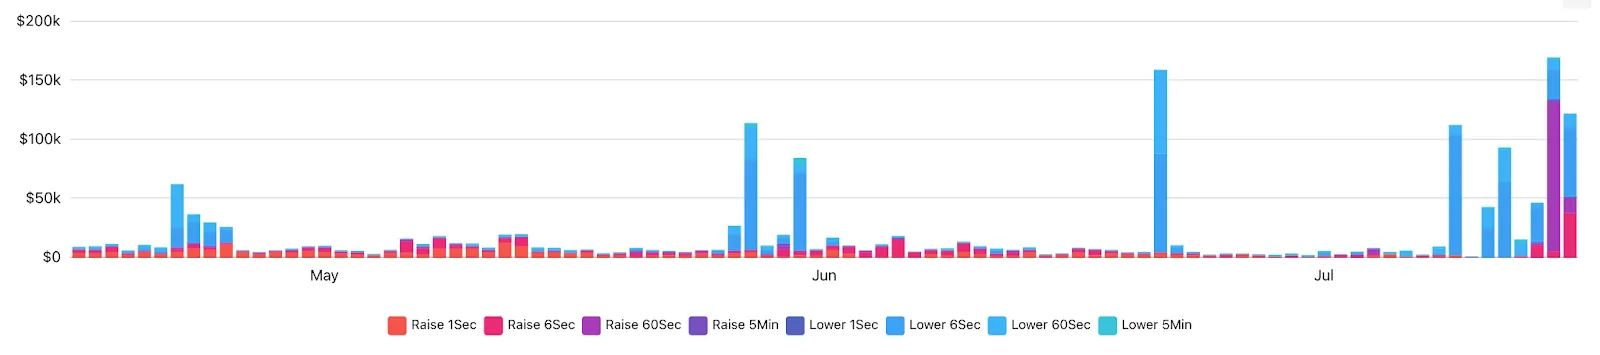
Notice the variation in the earnings, and the contribution of each of the markets. Increasingly, it is the 1 second markets that generate the most income for participants.
This is a shallow market with relatively few participants. In mid 2023 there were just 69 participants providing FCAS across the NEM. The website nembess.com lists many of them along with their capacity and revenue. While competition is relatively limited, the need for these services makes it valuable for those who can provide them.
There is some debate as to whether the Contingency FCAS market will grow in the coming years. In the State Of The Energy Market 2023, the Australian Energy Regulator noted that “further augmentation of the network…will likely continue to create long outages and extended periods of reliance on local FCAS services.” At the same time, as new participants enter the market, supply of the services will grow driving competition up and prices down.
What’s required to participate in the FCAS Market?
Businesses can participate in the Contingency FCAS market with a range of assets other than batteries. Diesel generators can provide power, and heating or cooling systems can be turned off to reduce power.
But batteries are particularly well suited because they can both raise and lower frequency and they can respond very quickly, enabling them to participate in all eight contingency markets.
Indeed, batteries are the largest provider of FCAS in the NEM. In the second quarter of 2023 they provided a record 40% of all FCAS (by volume).
So, assuming we’re focused on participating with a battery, here is a massive oversimplification of the main requirements:
- Regulatory Registration: Battery owners must register with AEMO as a market participant (e.g., generator or ancillary services provider).
- Technical Requirements: Batteries must prove they have the ability to provide fast frequency responses with rigorous testing before being accredited by AEMO.
- Metering and Telemetry: Batteries must have compliant systems for accurate monitoring and reporting of performance.
- Connection Agreements: Agreements with the local network service provider are required.
- Capital Costs: Investment in technology (batteries, control systems).
- Market Knowledge: Understanding FCAS bidding and market dynamics.
Should you go solo or partner with an aggregator?
While it’s possible to purchase, register and run a battery on your own, for most businesses the better option is to partner with others. There are a number of reasons.
For a start, the minimum bid in the Contingency FCAS markets is 1 megawatt. A few market participants can offer this on their own (like the Hornsdale Power Reserve), but more commonly, the capacity is created by aggregators who link many batteries together in Virtual Power Plants (VPPs).
Battery aggregators include companies like Powersync, FlowPower, Hydro Tasmania, Viotas, and Diamond Energy. Beyond linking your battery to others to provide you the scale you need to bid, they can also assist you with a number of important tasks. Here is a taste:
- The operator of the battery must be a registered Market Participant. For many businesses for whom FCAS is not a core capability, this is best left to others.
- Preparation is required to ensure batteries meet performance standards for fast response.
- Biddable capacity and response settings can sometimes be negotiated with AEMO.
- The installation must have metering equipment and telemetry systems which meet AEMO’s requirements for data accuracy and real-time reporting.
- Connecting a battery to the wholesale market requires a child meter which must be owned by a third party (not your business).
- The operator must comply with the National Electricity Rules, which govern market participation. Significant fines are payable for failure to delivery.
- Once registered, the operator needs to understand bidding strategy to maximise returns where minimum bid sizing and a shallow market often present challenges.
Given this complexity, we recommend the first step on this journey needs to be a feasibility study. Partners, consultants or large installers can help you with this, and you can run the analysis using feasibility modelling tools - like Orkestra!
Book a Demonstration
Book a meeting with the Orkestra team in your region
What drives the feasibility of investing in FCAS participation?
Feasibility will be different for every site based on location, energy requirements, and other factors.
Very detailed data on energy consumption and forward price curves are used to determine whether the business case stacks up and what return on investment can be expected. Multiple scenarios are modelled to identify the optimal system based on financial outcomes.
One of the key steps in this process will be to work out the optimal battery size.
Below is an example of modelling done in Orkestra for a manufacturing site in NSW consuming 1.9 megawatt hours a year. 132 different solutions were modelled, each with a different combination of solar and battery system sizes. The chart below shows them ranked by net present value over 10 years of cash flows with a 5% discount rate (each column represents a different solution).
The best solution (far left) has a 1,250kW solar system and 400kWh battery. It has an NPV $50k higher with FCAS than without, and provides $30k more in first year savings.
.webp)
The batteries modelled here ranged from 200 kWh to 700kWh, all with a 2 hour rating, all priced at $850 per kWh with annual maintenance costs of 1% of the upfront cost. The FCAS scenarios include costs for the battery aggregator / market participant of $20k upfront and $1500 per mega watt.
When grouped by battery size, it’s possible to see how the addition of FCAS changes the value of the solutions.
.webp)
Here's a comparison of how that top solution looks with FCAS:
.webp)
and without FCAS:
.webp)
It’s possible that other batteries may yield better results. For example, a battery that can charge and discharge in less than 2 hours may perform better in delivering FCAS. Also, in this modelling we’ve (conservatively) assumed 41% of the battery capacity would be made available to the market, but in some cases that can be as high as 100%. This is the sort of thing a battery aggregator will advise.
Also, this modelling is based on FCAS market prices taken from NSW 2023 with CPI factored at 2.5% per year. The table below shows the impact of choosing different price curves. Here we’ve kept all other factors constant to compare historical prices from 2021, 2022 and 2023. The scenario with the highest NPV for each price data scenario is marked with a small star.
Orkestra provides these historical prices for modelling but recommends you consult energy data specialists who can provide future FCAS market prices based a range of deeply considered factors.
.webp)
2021 pricing yielded an NPV of $990,822 compared to that of 2023 pricing at $949,190. A difference of over $41k.
It should go without saying that the aim is not to find the pricing data with the highest returns, rather the one that most accurately reflects what will happen in the future. Clearly selection of pricing data is very important.
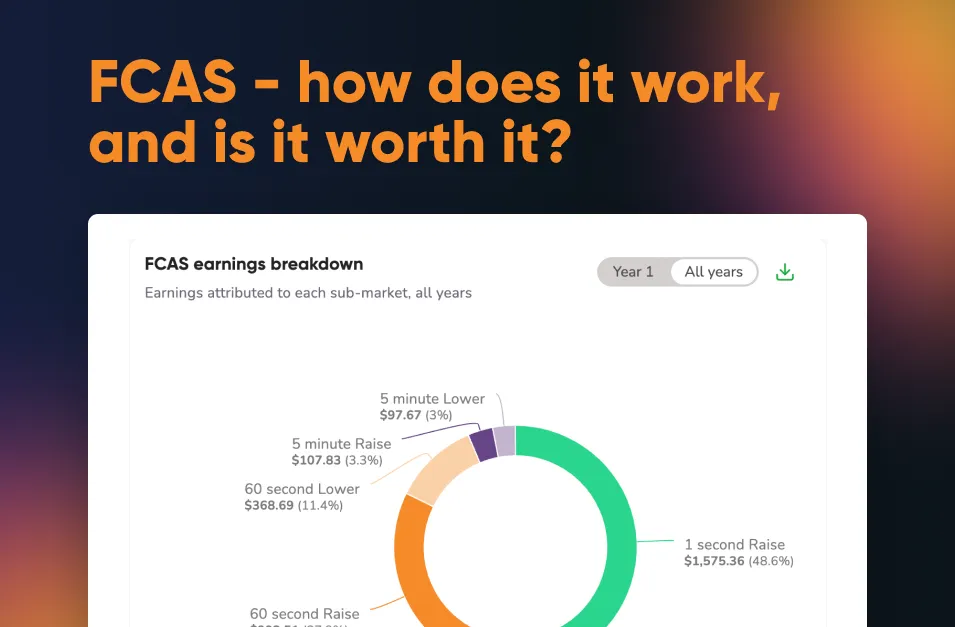
Now we can see what’s driving the value overall. The chart below shows the earnings breakdown for the 2023 FCAS scenario from above. FCAS contributes only 3.9% to overall earnings forecast over 10 years. The solar and battery system will deliver value in a number of other ways, and as is common, these results show that replacing grid energy with solar energy, and reducing peak demand charges are the most valuable elements.
.webp)
There are thousands of data points and dozens of assumptions in this modelling, so results should not be considered indicative of your business might expect. Hopefully this example gives you an indication of what a good feasibility analysis can, and should tell you before any investment is made.
Final Thoughts: Is FCAS Worth It?!
The answer depends on your specific circumstances. While FCAS can provide additional revenue, it should be viewed as a complementary benefit rather than the primary driver for battery investment.
Conducting a thorough feasibility study with experts and using advanced modelling tools like Orkestra can help you make an informed decision.
Want to talk to our team further about FCAS and get help setting up and analysing your first project? Book a one-on-one demo or start a free 21 day trial of the platformand we can go from there!