Blog /
Industry Insights
Your Guide to Interval Data Cleaning and Reconciliation
March 23, 2026
.png)
Why So Many Site Setups Go Wrong
If you've ever tried to upload an energy load profile to Orkestra and found yourself stuck, confused, or unsure whether your data is even right, you're not alone. Interval data is one of the most common points of struggle in the site baseline setup process, and it's also one of the most important to get right.
Your interval data tells the story of what a site actually does - day in, day out. It shapes the load profile, dictates how solar and battery consumption are overlaid, and ultimately determines the difference between a solution that generates material savings and one that misses the mark entirely.
Get it wrong, and the problems don't stay contained. Inaccuracies here have flow-on effects throughout your scenario modelling, your cost estimates, and your project outcomes. Get it right, and you build from a foundation of confidence.
This article will walk you through how to approach your interval data before you upload it and what to check once you have
What Is Interval Data, and Why Does It Matter?
Interval data is the record of a site's energy consumption captured at regular time intervals, typically every 30 minutes or 5 minutes. It's what gives you the shape of a customer's operations: when they're drawing energy, how much, and how that pattern shifts across days, and seasons.
In Orkestra, this data forms the core of your site baseline. It's the foundation everything else is built on - scenario modelling, solar and battery overlays, and cost projections.
Interval data comes in a range of formats, and that variety is exactly where the confusion begins.
The two most common formats you'll encounter are:
- NEM12 - a standardised matrix format that can generally be uploaded directly to Orkestra with minimal intervention. Issues occasionally arise when headings have been manually adjusted before the file reaches you.
.png)
- Retailer-provided data - typically column-based, with separate streams for energy imported from the grid, energy exported to the grid, reactive power, and sometimes time-of-use periods.
.png)
Knowing which format you have is step one. But knowing whether that data is clean and complete is crucial.
Step 1: Open the File (Yes, Really)
This sounds obvious, but it's worth saying plainly: open your Excel file before you attempt to upload it. A surprising number of people skip this step entirely and go straight to uploading and that's where problems begin.
Once you have the file open, here are the checks to work through.
Step 2: Filter Your Columns
The first thing to do is apply filters to all columns. This quick action can reveal a lot about the state of your data.
What you're looking for:
- Multiple NMIs — Each project in Orkestra represents a single NMI (National Metering Identifier). If your file contains data for more than one NMI, you'll need to split them into separate files before uploading.
- Multiple sub-meters — If sub-meter data is present, you'll need to combine it. Line up the timestamps across sub-meters and add the kilowatt-hour values together to produce the total load for the NMI. That combined total is what you upload.
- Quality flag changes — A change in the quality flag partway through the data can signal an issue worth investigating before you proceed.
Step 3: Check Your Date and Time Coverage
Once your columns look clean, turn your attention to the date and time column. Orkestra requires a minimum of around 7 to 8 months of data and will extrapolate the rest, but it can also handle minor gaps here and there. What it won't accept is a very short dataset (say, 2 to 3 months) or significant gaps in coverage.
Ideally, you want 12 months of data.
The recommended way to check this:
- Insert a new column directly next to your existing date/time column.
- Recreate the date/time sequence in that new column, starting from the same date and incrementing by whatever the data granularity is (e.g., 30 minutes for half-hourly data).
- Copy that sequence all the way down through the file.
- Jump to the bottom and compare your two end dates.
If the dates match, your data is consistent. If they don't, something has changed partway through, the granularity may have shifted (for example, from 30-minute to 5-minute intervals), or there may be missed or repeated intervals.
This mismatch doesn't always mean the data is unusable, but it does mean you'll need to investigate and make adjustments before uploading.
Step 4: Watch for Outliers
If you notice values in your data that seem unusually high or low, outliers that don't seem to fit the pattern, don't just upload and hope for the best. Take the time to go back to the customer and confirm whether those values accurately reflect site operations before proceeding.
This is a judgment call, but it's an important one. Data that looks strange usually is strange, and it's far easier to resolve it now than after it's embedded in your site baseline.
Step 5: Reconcile After You Upload
Uploading the data isn't the end of the process, it's the beginning of a verification step. Once your interval data is in Orkestra, you'll be able to see the annual megawatt-hour estimate it has generated.
Your job at this point is to reconcile:
- Does the estimated annual load match what you'd expect based on the interval data you uploaded?
- Does it align with any other available data, such as billing information or an energy contract?
This is your first and best opportunity to catch any inaccuracies before they travel further into your project.
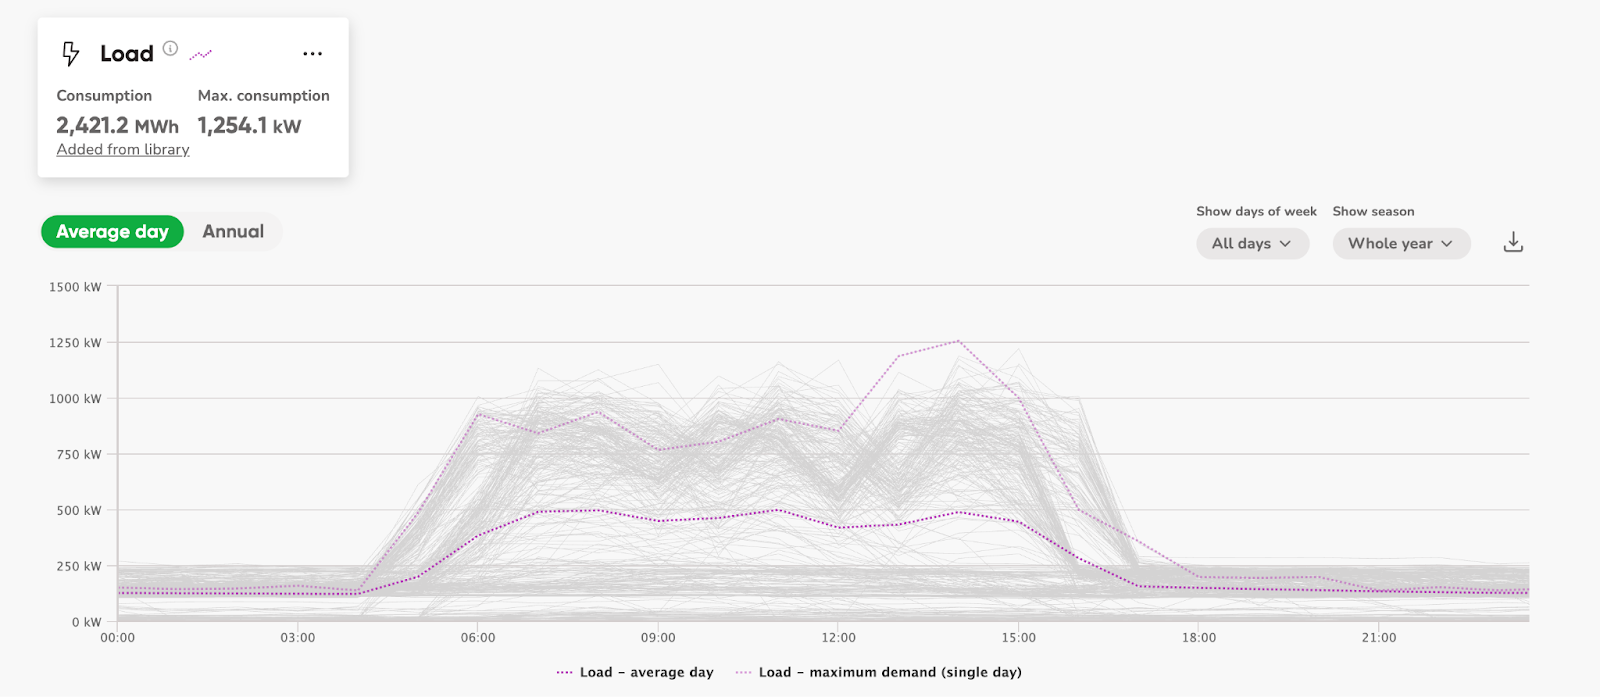
You should also take a careful look at the average load profile that Orkestra displays after upload. Does it actually reflect what you know about the site's operations? A profile that looks jagged, has strange outliers, or just doesn't make operational sense is a signal that something in the underlying data may need attention.
Good Load Profile
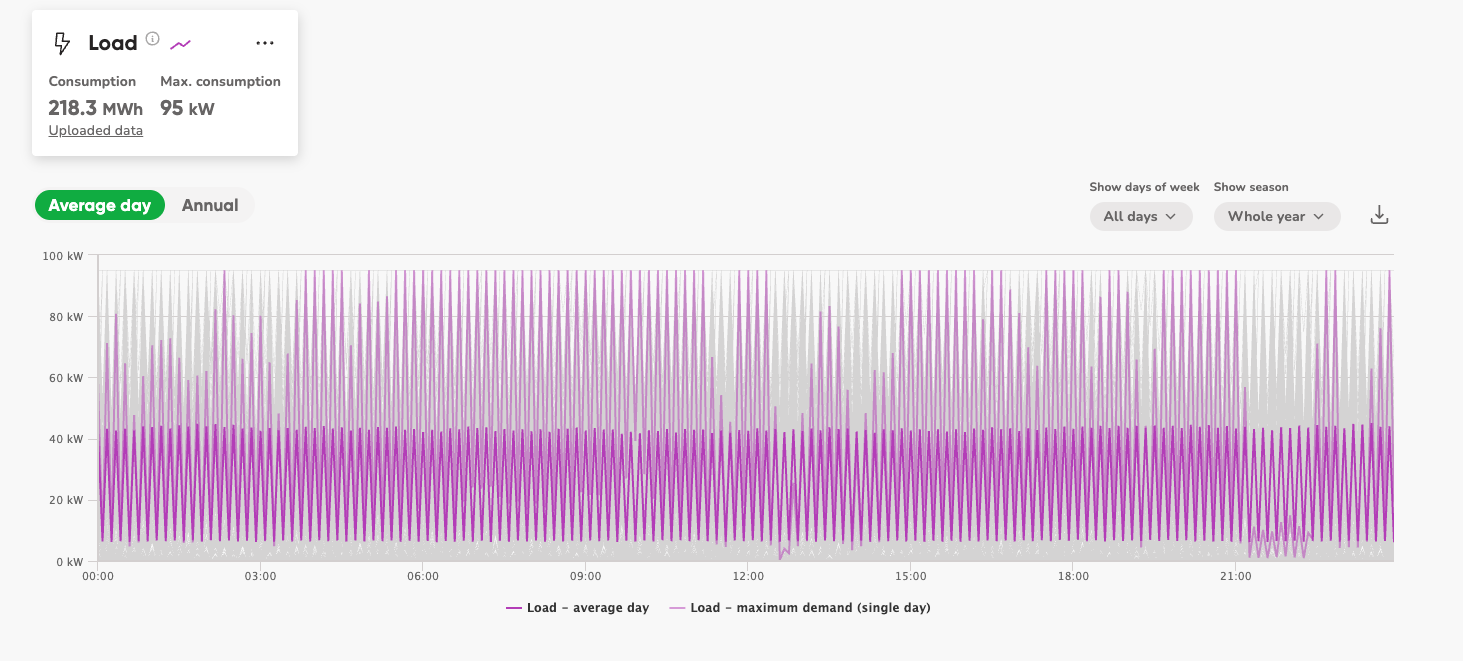
Bad Load Profile - Two NMI’s in one file
Common Mistakes to Avoid
Even experienced users fall into these traps:
- Uploading without opening the file. The checks described above take minutes. Skipping them can cost hours later.
- Trusting the data at face value. Interval data from retailers and meter providers isn't always perfect. It's your job to verify it, not assume it.
- Ignoring the visual after upload. Orkestra gives you a load profile to look at. It's one of the fastest ways to spot a data problem.
- Not reconciling the annual load estimate. If you skip this step, you may not discover an inaccuracy until you're deep into scenario modelling or cost estimation, at which point tracing the problem back to the source becomes significantly harder.
What's at Stake If You Get It Wrong
If interval data is uploaded with errors, the consequences compound quickly:
- Overestimation or underestimation of annual load — even if Orkestra interpolates your data, inaccuracies in the source will skew the output.
- Inaccurate peak demand figures — which affects the shape and sizing of any solar or battery solution.
- Flow-on effects to scenario modelling — because the site baseline is the foundation, anything built on top of it inherits the same errors.
- Inaccurate cost estimates — leading to scenarios that don't reflect reality and conversations with customers that are harder to defend.
The site baseline is the foundation of your entire project. What you build here determines the accuracy of everything that follows.
Conclusion: The Skill Worth Developing
Working with interval data well is a skill, and it's one that pays dividends across every project you set up. The steps outlined here aren't complicated, but they do require attention and intention. Opening the file, filtering the columns, verifying the date range, watching for outliers, and reconciling after upload - each of these is a small investment that protects the integrity of everything downstream.
Take the time at the start. Understand what's in the data. Make sure it reflects what's actually happening at the site. And once it's uploaded, verify that what Orkestra is showing you makes sense.
Do this consistently, and you'll build site baselines you can stand behind and solutions that deliver the outcomes your customers are counting on.
Want to go deeper? Check out our step-by-step guide on how to upload interval data to Orkestra, including format-specific instructions and example files.
Ready to put these best practices into action? The best way to truly understand interval data is to work with it firsthand. Start your 3-week free trial in Orkestra today and set up your first site baseline with the confidence of knowing exactly what to look for. Start Your Free 3-Week Trial
Get your 3 week free trial
Get started exploring energy project feasibility analysis and reporting. Sign up now - no credit card required.